Addressing Redis issues to enhance stability and speed
Sometimes, things go wrong at Transloadit. When that happens, we want to be transparent about it and own up to our mistakes. In that light, I'm disclosing an issue that affected 81 of our customers last week.
Early last week, reports came in of an increased amount of WORKER_JOB_ERROR errors. This tells us
that there is a communication problem between our Uploaders (the machines receiving files and
orchestrating Assemblies) and our Drones (the machines executing encoding tasks).
We shared the problem on Twitter and transloaditstatus.com, and started investigating.
Being the authors of the retry module, we have implemented retries for many things at Transloadit. This also means that nearly all Assemblies can be replayed without loss of data. In a few cases, though, Assemblies could not be replayed, and in many other cases, they were just much slower, due to retries with exponential back-offs kicking in when there were errors.
After digging through our logs and debugging the code, it appeared we were losing Jobs that are queued in the us-east regional Redis cluster, as well as heartbeats between the aforementioned Uploaders and Drones. Monitoring heartbeats allows us to give a Job to a different Drone, should the original Drone stop emitting them.
We immediately applied a band-aid fix by re-adding messages that got lost and relaxing our heartbeat monitoring. This approach was, however, merely fighting the symptoms, as opposed to attacking the root of the problem. Moreover, it also came at the expense of increased Assembly execution times. In other words, we needed to do more.
The plan of action
The team, thus, came together and various members were sent on different routes to establish the root cause of the issue. To be more specific, we:
- Verified whether we missed out on any critical Redis patches and upgraded to the latest stable version.
- Did a full code audit of our client-side library and evaluated the way we are using it.
- Enhanced our monitoring, metrics, alerts, and log entries. Numerous metrics are already monitored, but we can only set up sensible alerts for so many. It is possible that our selection fell short.
When the team reconvened to share their findings, problems had been found on several fronts:
- We were not running the latest version of Redis, in which a number of alarming bugs had been
fixed, some of which were marked with
[FIX] Fixed data loss. - The team found no problems in the recent version of the client-side library that we were using. ✅
- We had been tracking the number of Redis commands, connections, and swap usage, to name a few, but not the bandwidth. We had been running on a 3 node cluster in the US, and it seemed unlikely that we would saturate all of their network cards. Upon closer look, however, it turned out that was exactly what we had been doing.
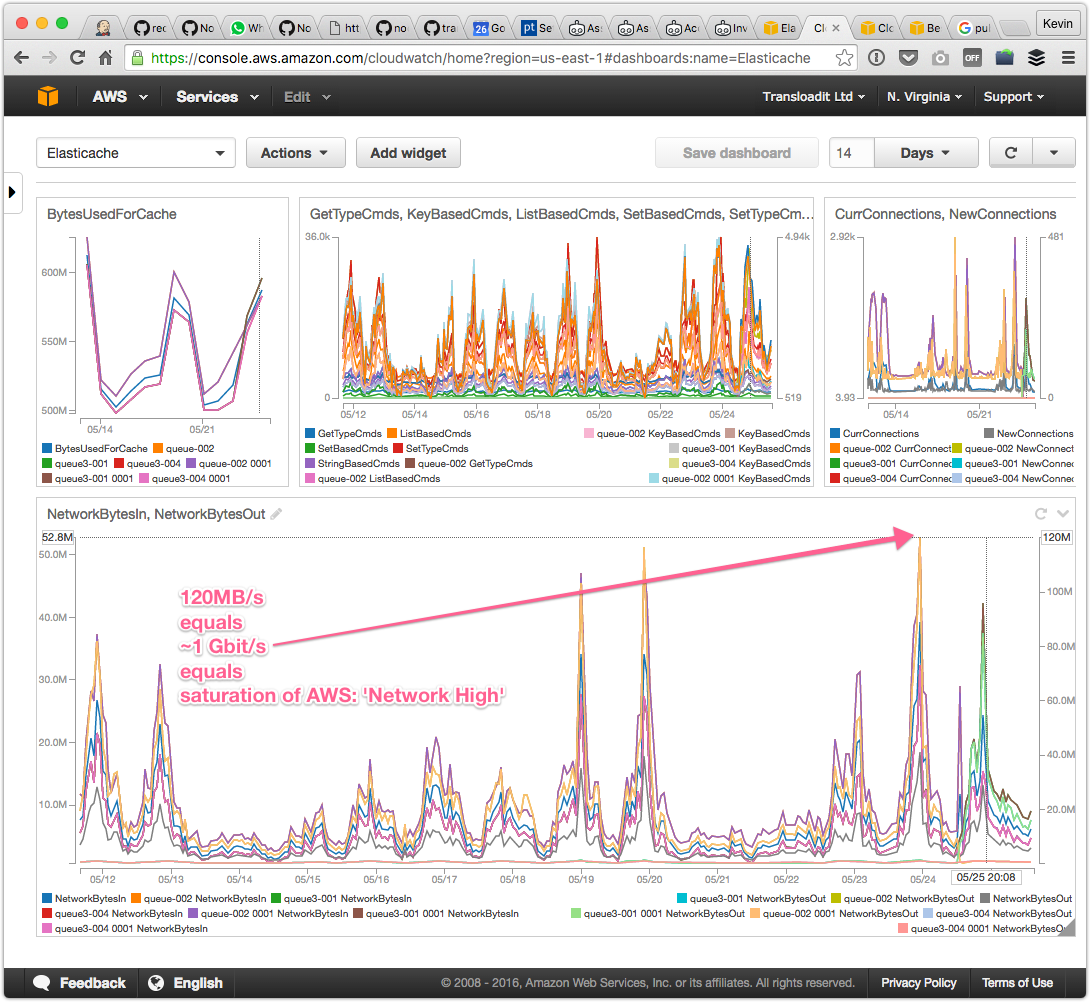
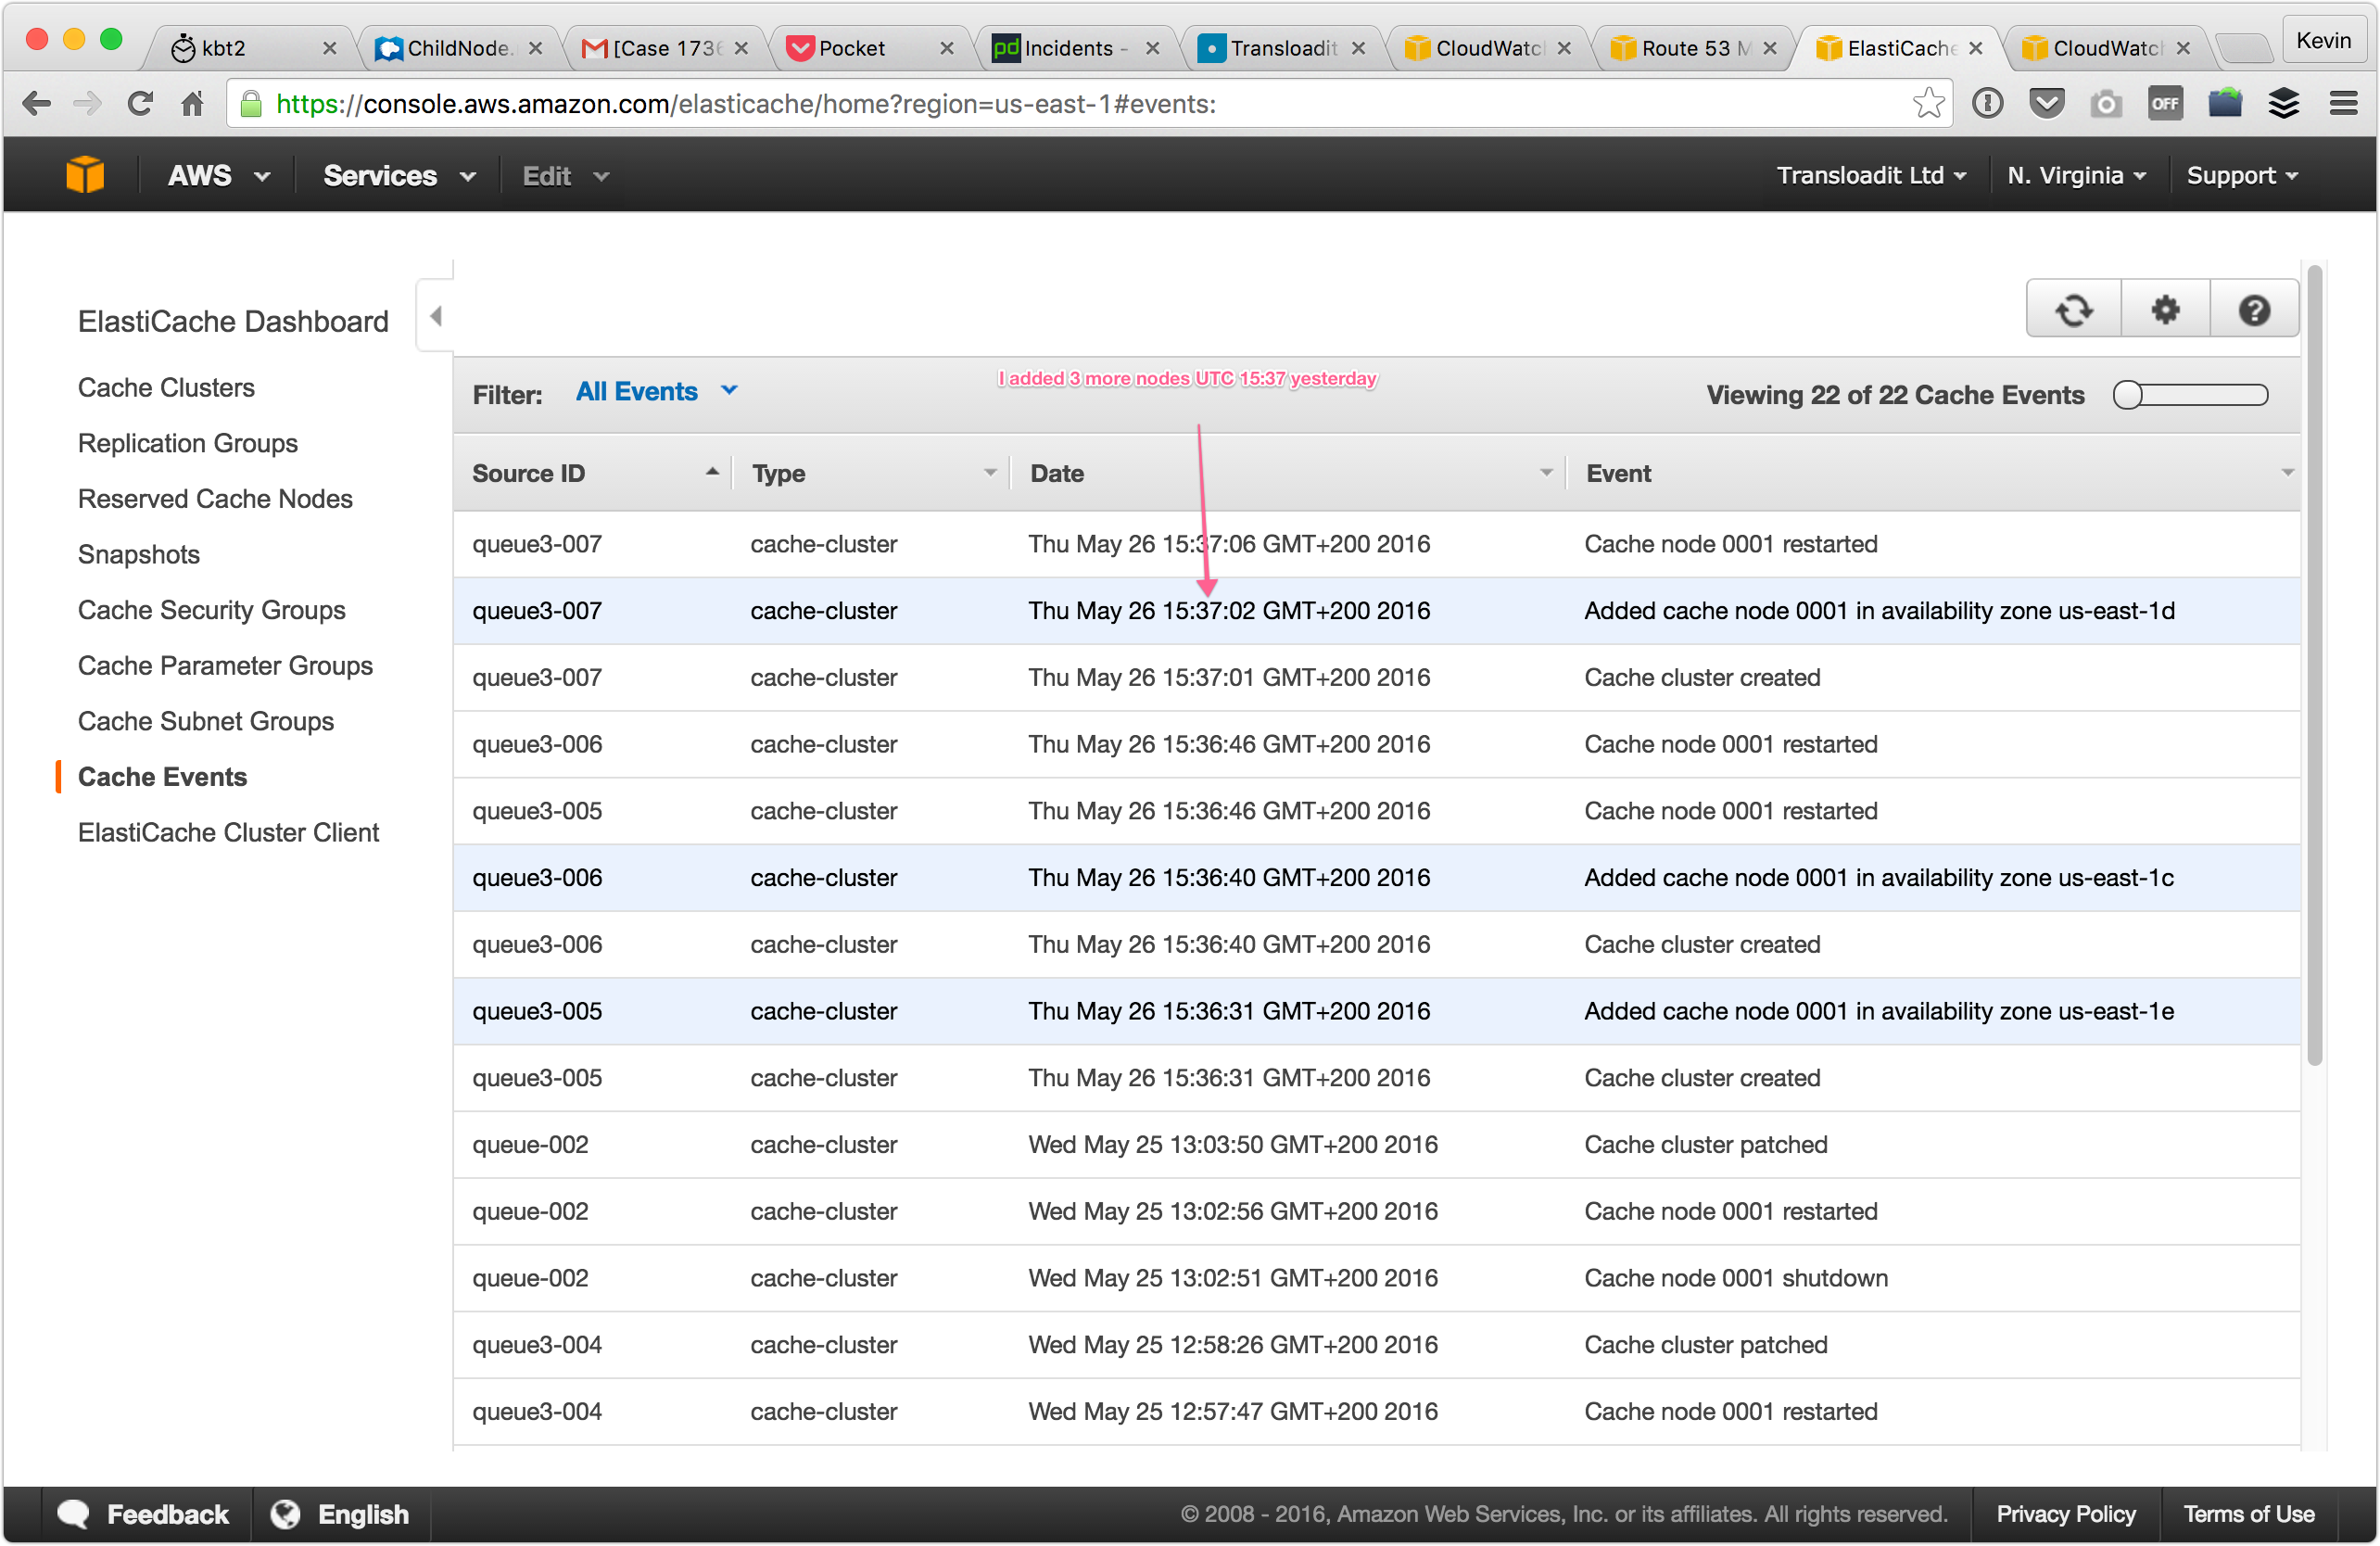
As soon as it became apparent that we were bandwidth throttled, we doubled the size of our cluster. This should spread the workload across six Redis nodes, resulting in a total read throughput of ~6Gbit/s. We were convinced that this would surely be enough.
After this, we noticed an immediate increase in bandwidth consumption:
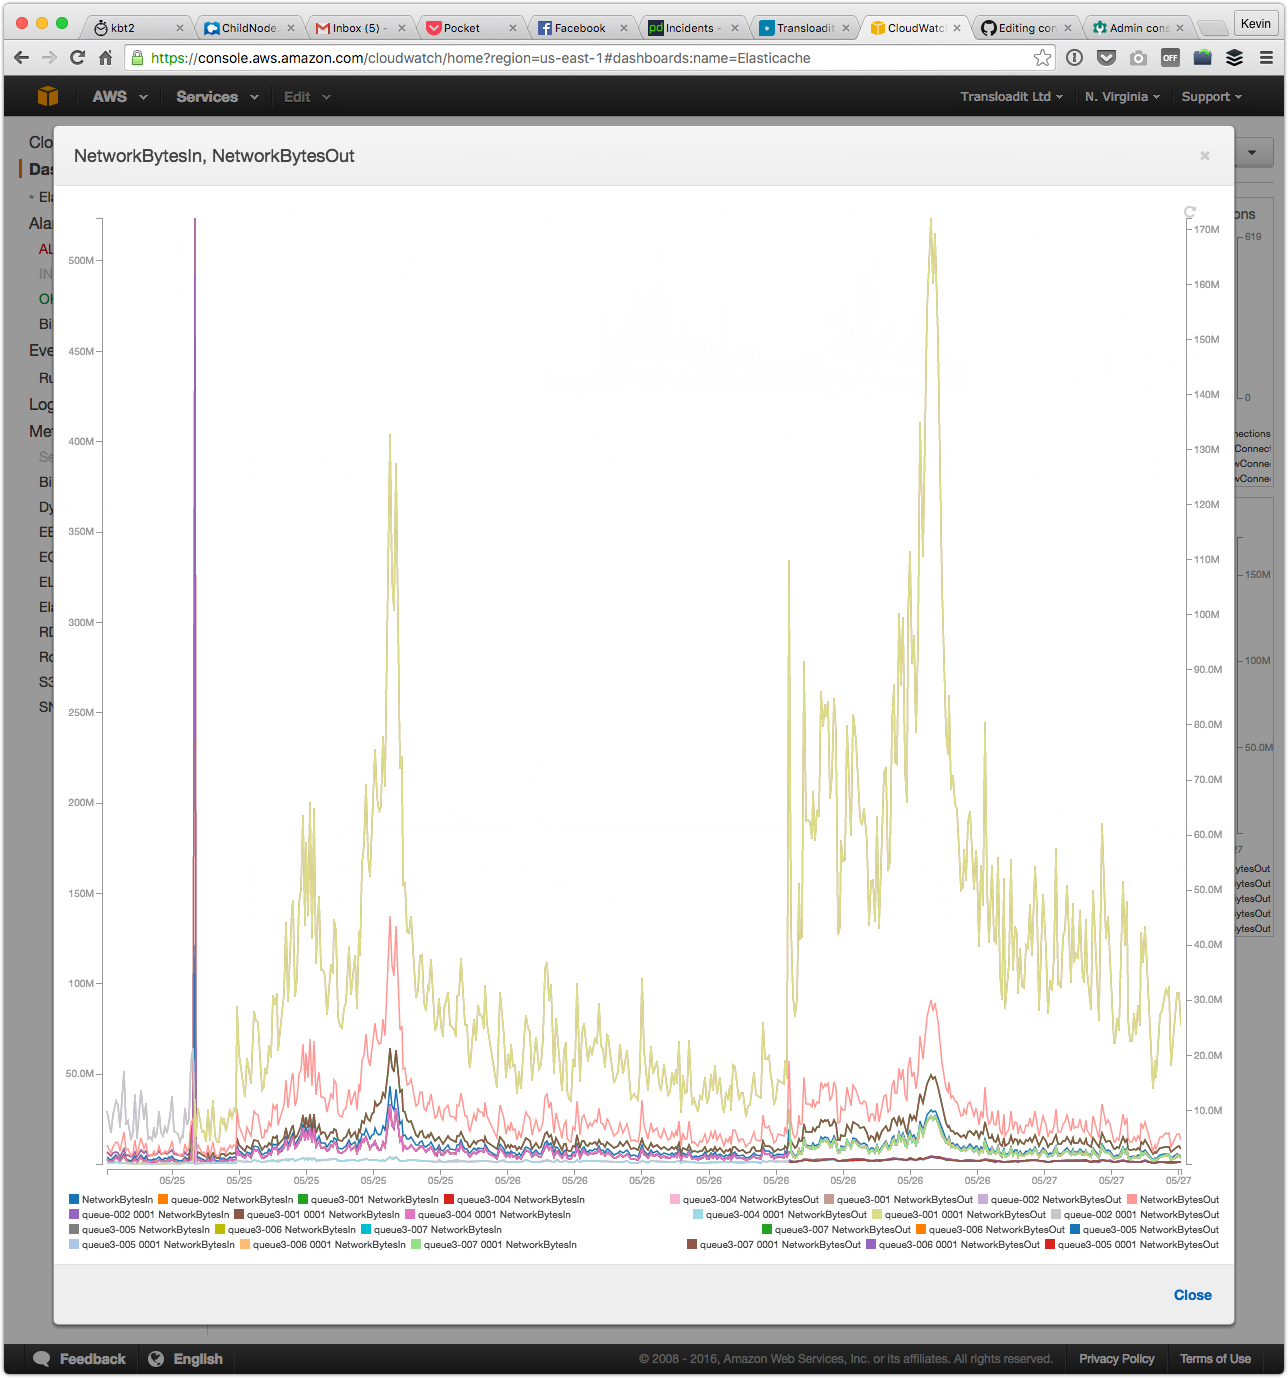
The consumption was, however, quickly reaching new saturation points and many Assemblies remained slow. We initially thought that we were still underestimating the required size of our cluster. We had been throttled by the limitations of three Redis nodes, and since six Redis nodes didn't appear to be sufficient either, we added another three Redis nodes to see how that would impact the bandwidth consumption.
Much to our surprise, this only seemed to make matters worse. Upon taking a closer look, we noticed that the bulk of outgoing traffic was generated by the cluster leader. At ~4Gbit/s, it was now emitting way more traffic than Amazon advertises is even possible (which might be interesting material for a later blog post), while the traffic on other Redis nodes remained well within boundaries.
This was odd because outgoing traffic (reads) should be spread across the entire cluster. Why did the leader generate so much of it? Apart from handling writes and Pub/Sub, it should only be emitting approximately one ninth of the total outgoing traffic.
Less is more
Only then, it hit us: replication. Every write went to the leader, and – instead of syncing the written bits to two Redis nodes – it now had to sync this data to eight Redis nodes. Since Redis does not have a fancy protocol like gossip in place, everything our Drones submitted now had to be copied to eight nodes instead of two (which was already problematic). That is four times more work and outgoing traffic to emit for this single Redis leader.
To make matters a little extra painful, our data is write-intensive and highly volatile. It will only be useful for a brief moment in time. So, once the data had been copied, it also had to be deleted again pretty soon after that.
Since we can re-add missing data, we reconsidered whether the seemingly good idea of replication was actually a requirement at all.
Ideally, we would like to have zero replication traffic, and failover to a blank Redis node. With AWS Elasticache, however, replication is mandatory for automatic failover. With this newfound knowledge in mind, we brought the number of read replicas down to one. Our logs immediately showed a drop in both traffic and failure rates, and Assemblies also started to speed up again.
Breathe
Having finally found the root cause, we could breathe again, and we began to wonder how this could have happened. It was somewhat puzzling, since we could not find any changes made to our code or infrastructure that would explain the sudden saturation of our Redis capacity.
We did, however, notice two changes in the environment:
- A steep increase in HLS traffic. HLS segments big videos into many small fragments, allowing mobile users to download the next chunk of video at optimal quality for their current connection (gracefully degrading everything down to audio-only when the connection gets really poor). This can easily lead to a thousand times more metadata being passed around for each video.
- We can have more Drones online to process the same volume in a shorter time. This inherently leads to more busy central nodes
It was the combination of these two changes that exposed this bottleneck in our infrastructure. We subsequently made the wrong call by scaling up the number of Redis nodes to alleviate the problem, but it turned out that having more machines actually put a strain on throughput. To be able to handle more traffic, we had to use fewer nodes.
Looking ahead
As a result of our broad investigation, all software components mentioned above have now been upgraded, so we are no longer susceptible to known bugs that could lead to loss of heartbeats or data, outside of the bandwidth issues we encountered. We have also set up additional logging and alarms in case we should approach saturation levels again.
The traffic between the Redis nodes and our Drones and Uploaders was legitimate and therefore we will need to start looking at ways to decentralize this traffic. The reduction in replication traffic may have bought us some time, but we want to be able to sustain a growth that is not possible on just a single Redis node accepting the writes. Even if we scale up vertically (using a single bigger Redis node) with no replication, this puts a new bottleneck uncomfortably close in sight.
We thought about having read replicas of read replicas, allowing replication traffic to be shared, but – if our growth persists - that will also only buy us another few months. Moreover, being write-bound and knowing that these write must stay on a single machine, eliminates this option completely.
We also thought about moving to a different (distributed) datastore that is optimized for just this purpose, but such a large-scale migration will most likely take weeks, if not months, to complete. That is time we simply don't have. Swapping datastores mid-operation is already tricky enough, let alone when you are in a hurry.
Sharding seems to be our best bet at this point. Sharding allows you to compartmentalize data into different logical groups, and run each group on separate hardware (or on the same, but you get to decide). Other companies often shard per individual customer. We are currently already sharding per region and we now have plans to add additional sharding per Uploader. Sharding per customer seems less ideal in our setup, because one customer with a sizable import could singlehandedly max out Redis. We are, however, already scaling up Uploaders with traffic peaks, so we will gradually gain more Redis capacity as more traffic comes in. Traffic is tagged with the Uploader name, so it will also be apparent which Redis node will need to be addressed.
Work on this has already started and we are planning to launch it this week. In the meantime, we have put a cap on scaling up Drones for each region. This means that completing large batch imports might take a little longer than you expect, but the system will remain stable.
We are sorry
We understand slow execution times can be very frustrating, as is having to manually replay Assemblies that did not do so automatically. We want to offer our sincerest apology, as well as a week of free service to those of you that were impacted badly by this. Please reach out and we will make it right. Reimbursement of your money is, of course, probably not what you care about. A reliable service is. Nevertheless, we hope that it might ease the pain a little bit, and at that it helps to show that we are very serious about issues like these.